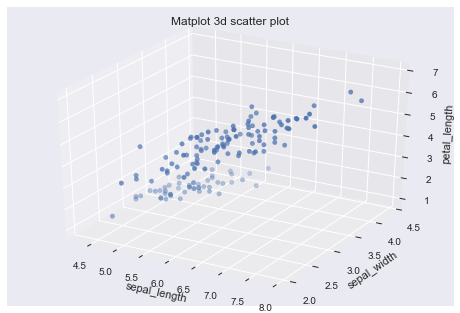
要点
使用例
import matplotlib.pyplot as plt
import seaborn as sns
from mpl_toolkits.mplot3d import axes3d
df = sns.load_dataset('iris')
xs = df['sepal_length']
ys = df['sepal_width']
zs = df['petal_length']
fig = plt.figure()
ax = fig.add_subplot(1, 1, 1, projection='3d')
ax.scatter(xs, ys, zs)
ax.set_title('Matplot 3d scatter plot')
ax.set_xlabel('sepal_length')
ax.set_ylabel('sepal_width')
ax.set_zlabel('petal_length')
plt.show()

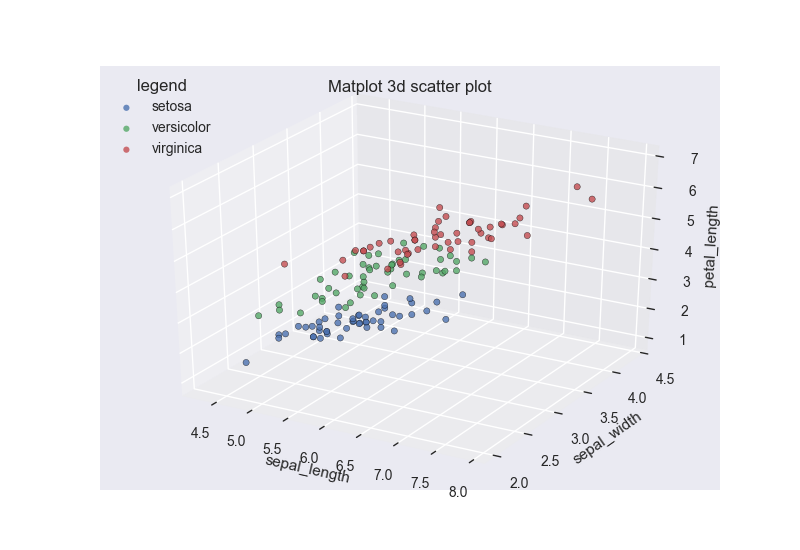
特定のグループごとに描画する場合
hue = 'species'
labels = set(df[hue])
dataset = []
for x in labels:
xs = df[df[hue]==x]['sepal_length']
ys = df[df[hue]==x]['sepal_width']
zs = df[df[hue]==x]['petal_length']
dataset.append((xs, ys, zs))
fig = plt.figure()
ax = fig.add_subplot(1, 1, 1, projection='3d')
for data, label in zip(dataset, labels):
ax.scatter(xs, ys, zs, label=label)
ax.set_title('Matplot 3d scatter plot')
ax.set_xlabel('sepal_length')
ax.set_ylabel('sepal_width')
ax.set_zlabel('petal_length')
ax.legend(loc=2, title='legend', shadow=True)
plt.show()


